
Updated Feb 2026
- As of Jan 2026 the global order book comprised 5,701 ships
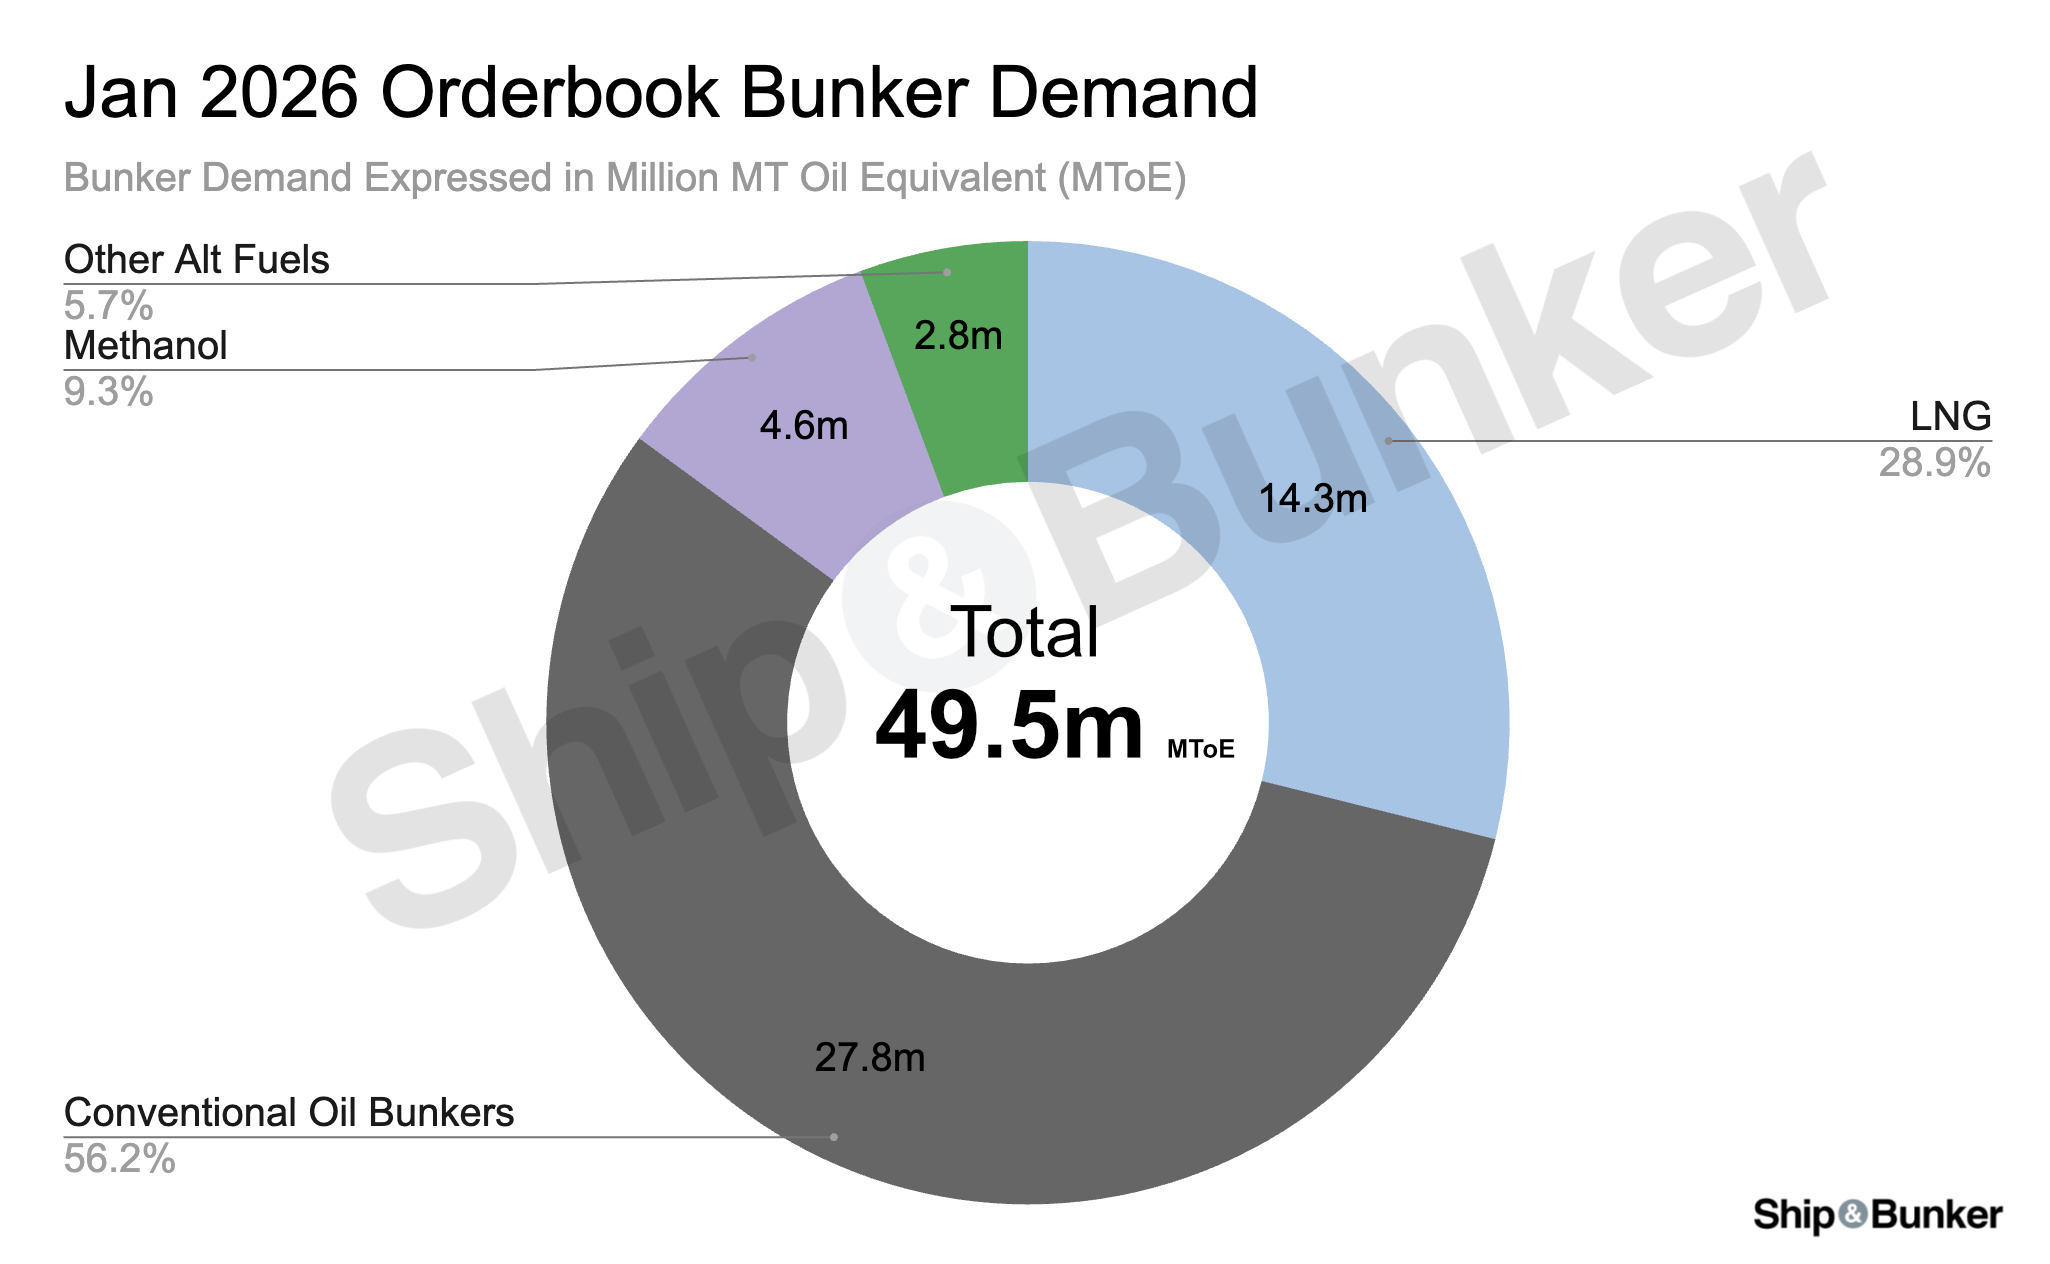
- Represents a combined 49.5 million MToE of bunker demand
- 56% of that demand is conventional oil bunkers
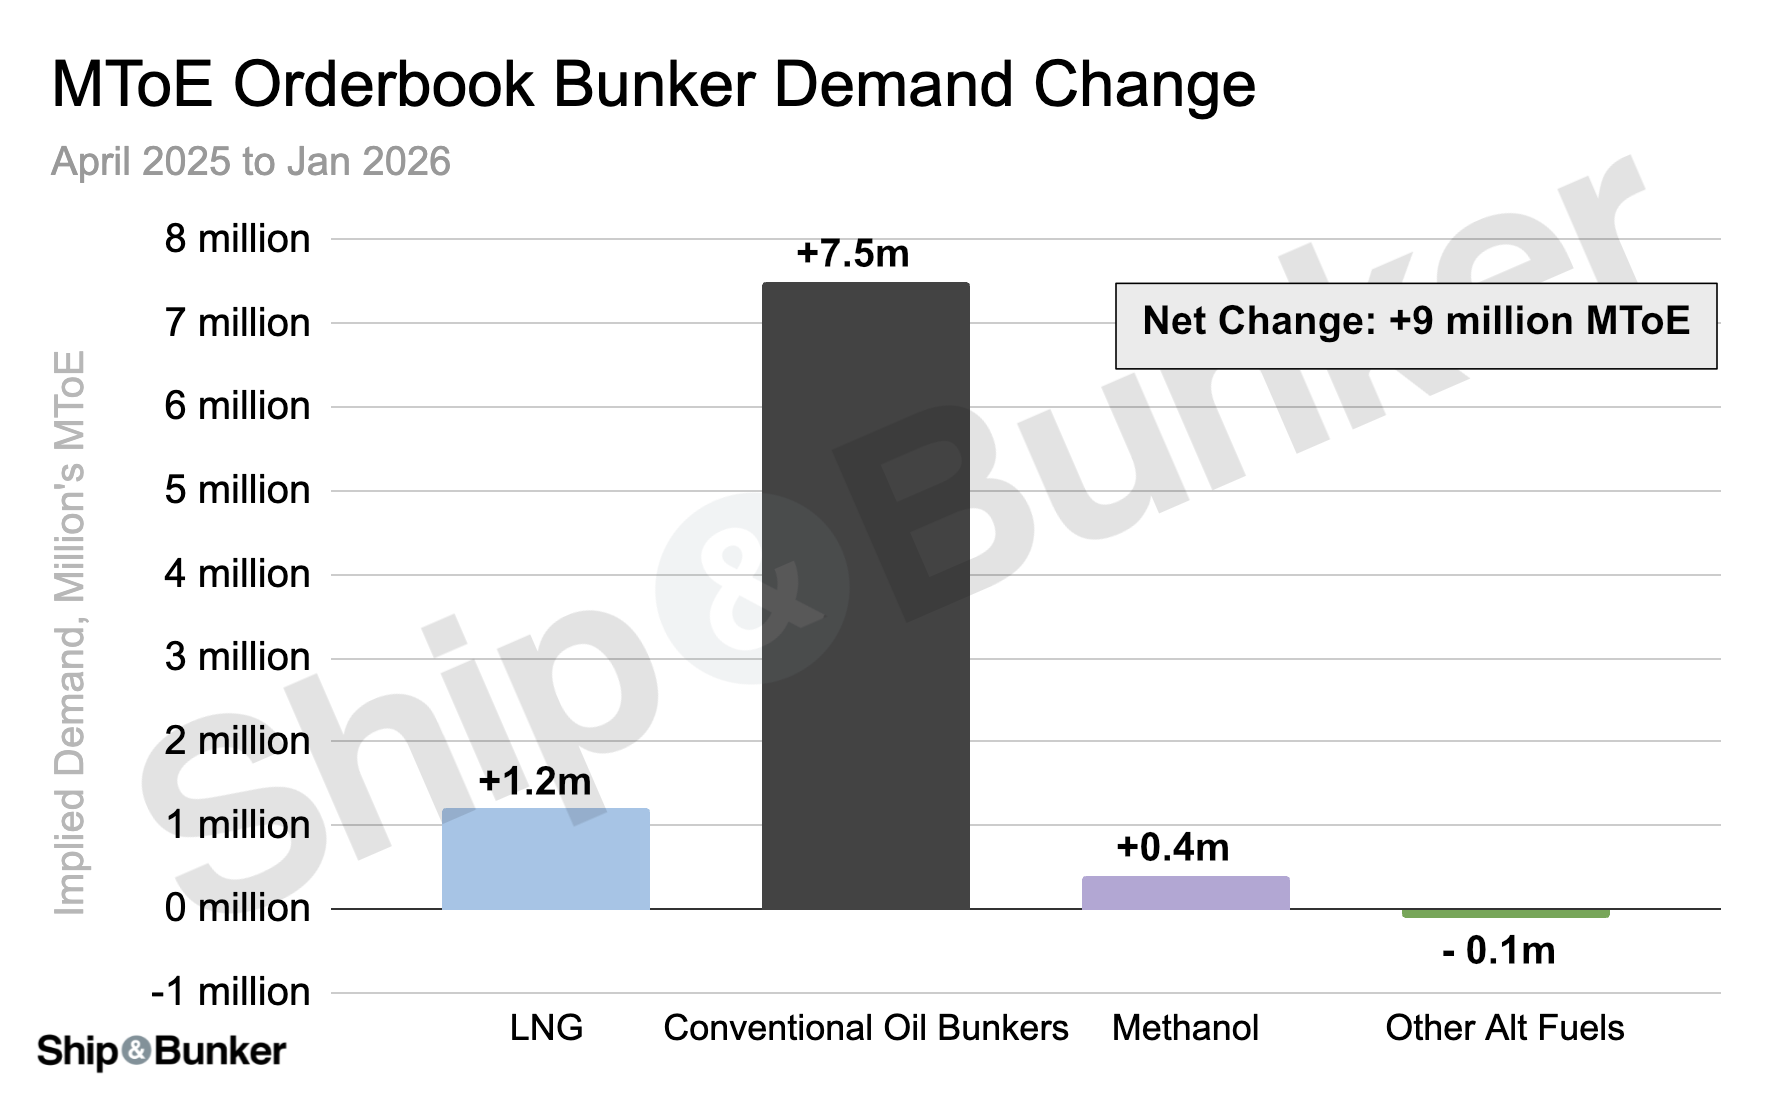
- Orderbook shows a net increase of 9 million MToE in demand compared to April 2025
- 7.5 million MToE (83%) of that increase is conventional oil bunkers
- LNG is the most popular alternative fuel for the orderbook, with 14.3 million MToE of demand
- Methanol engines account for 4.6 million MToE of demand
Anyone tracking the evolving marine fuel mix and the growth of alternatives such as LNG and methanol will be keen to know how many ships are being ordered capable of burning each fuel type.
However, what most market watchers ultimately care about is the bunker demand these ships will generate.
Since larger vessels consume significantly more fuel than smaller ones, looking at the orderbook in terms of bunker demand can look very different from the picture suggested by vessel numbers alone.
To understand the bunker demand represented by the current orderbook, Ship & Bunker has once again used fleet data kindly provided by Clarksons Research.
As alternative fuels and oil all have differing energy densities, bunker demand numbers in this report are all expressed in terms of metric tonnes of oil equivalent (MToE).
Bunker demand has been calculated using the latest IMO official fuel consumption data taken from "Report of fuel oil consumption data submitted to the IMO Ship Fuel Oil Consumption Database in GISIS" that lists actual fuel consumption for a total of 35 different ship types and sizes. For the January 2026 demand this analysis used the latest available data from IMO, which was the 2024 reporting year. The April 2025 analysis used the 2023 reporting year.
Key Insights
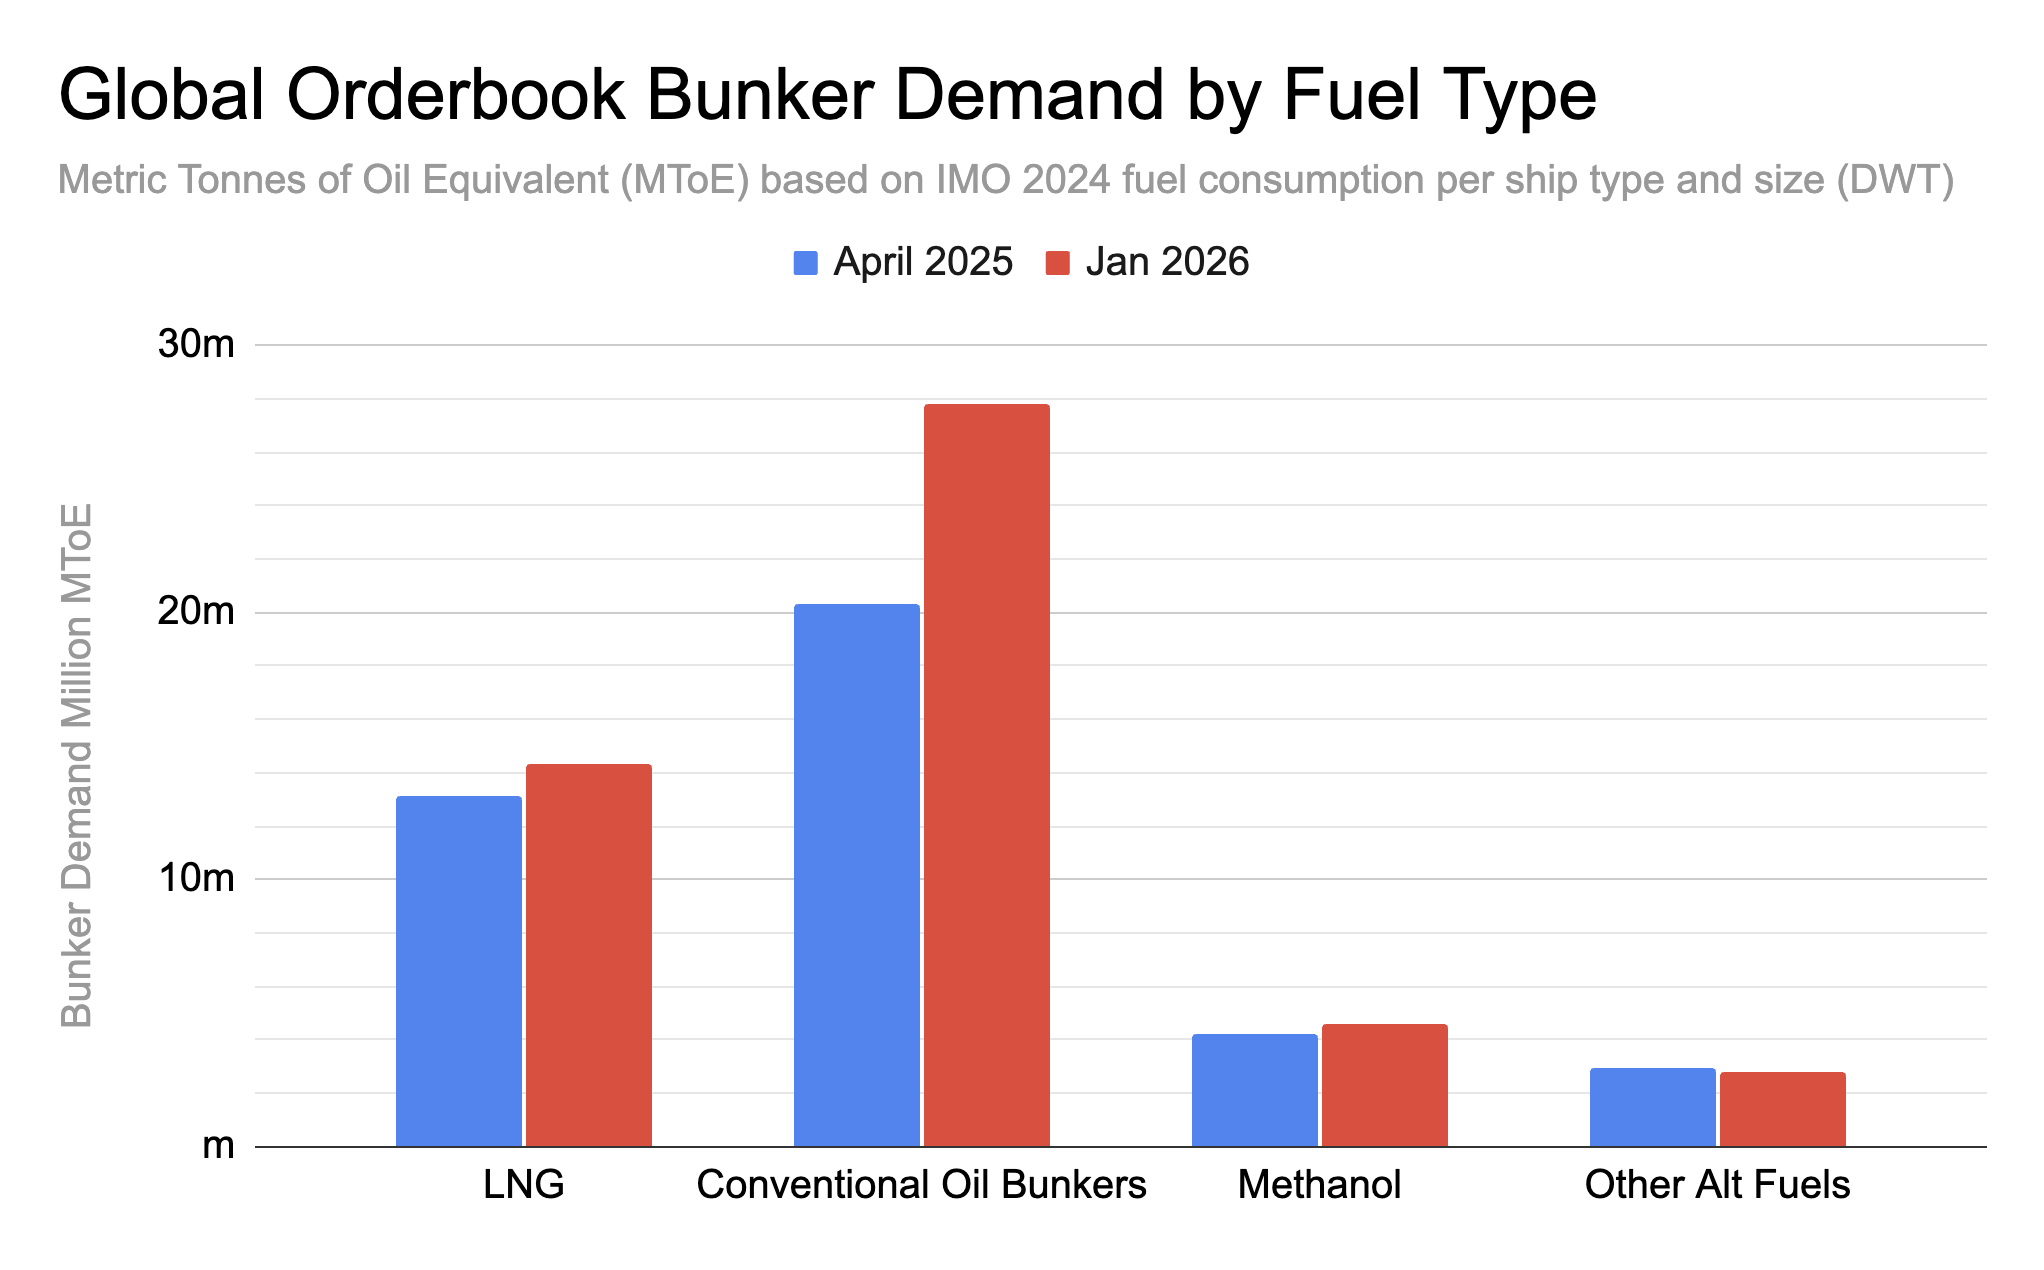
As of January 2026 the global order book comprised 5,701 ships representing a combined 49.5 million MToE of bunker demand, a net increase of 9 million MToE compared to April 2025.
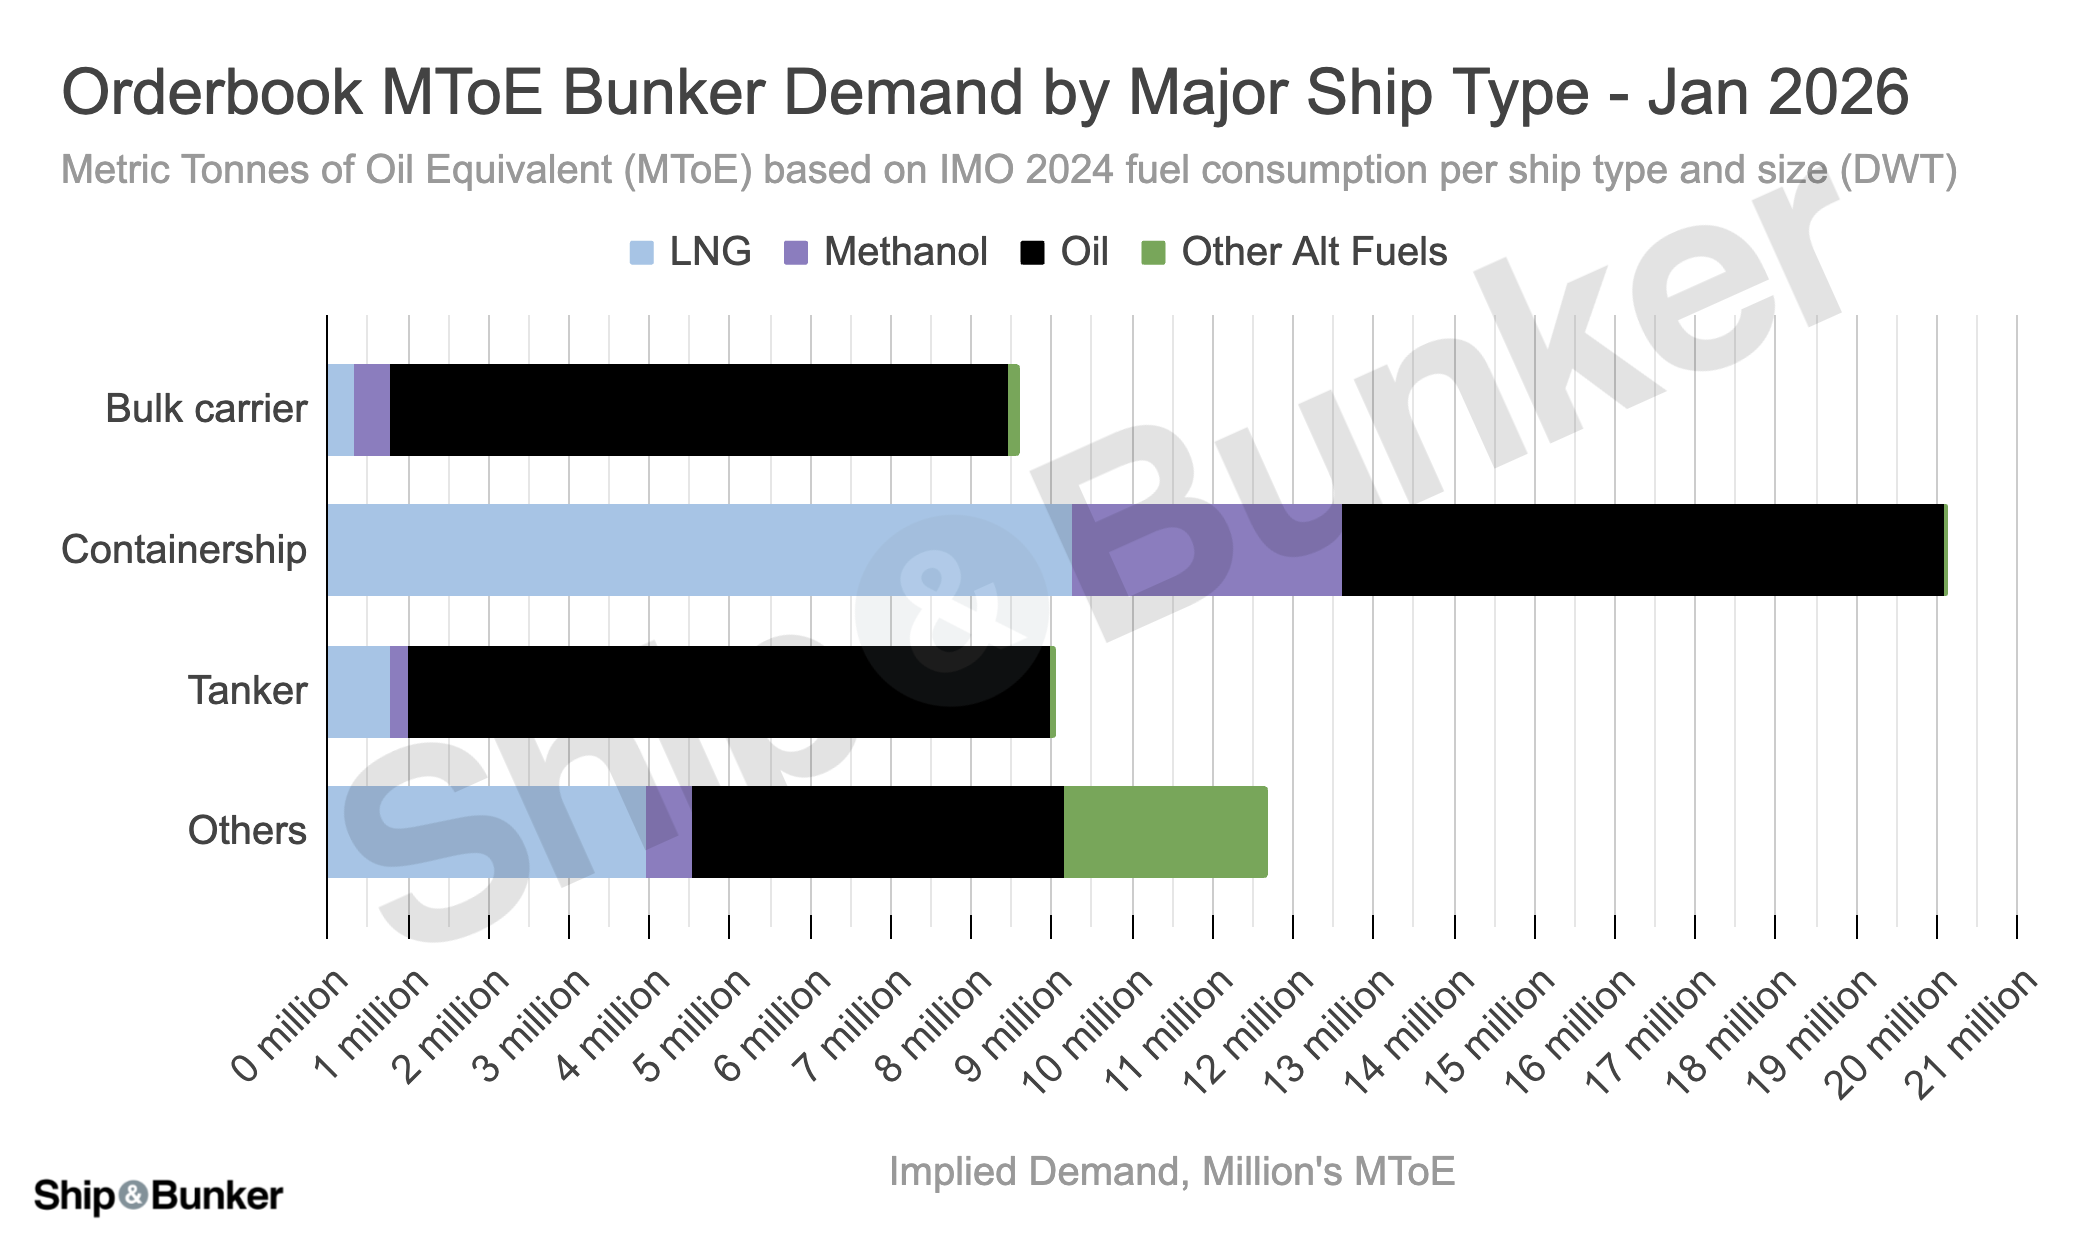
What is perhaps most notable is the fuel mix of the 9 million MToE net increase of bunker demand: 83% of it is conventional oil bunkers. Moreover, the demand is almost entirely attributable to oil-powered containerships. So with the October 2025 delay to the IMO NZF and news of a number of suppliers pulling back on their alternative fuel supply plans, we can now add the orderbook bunker demand as another clear signal of the current direction of travel for the industry's energy plans.
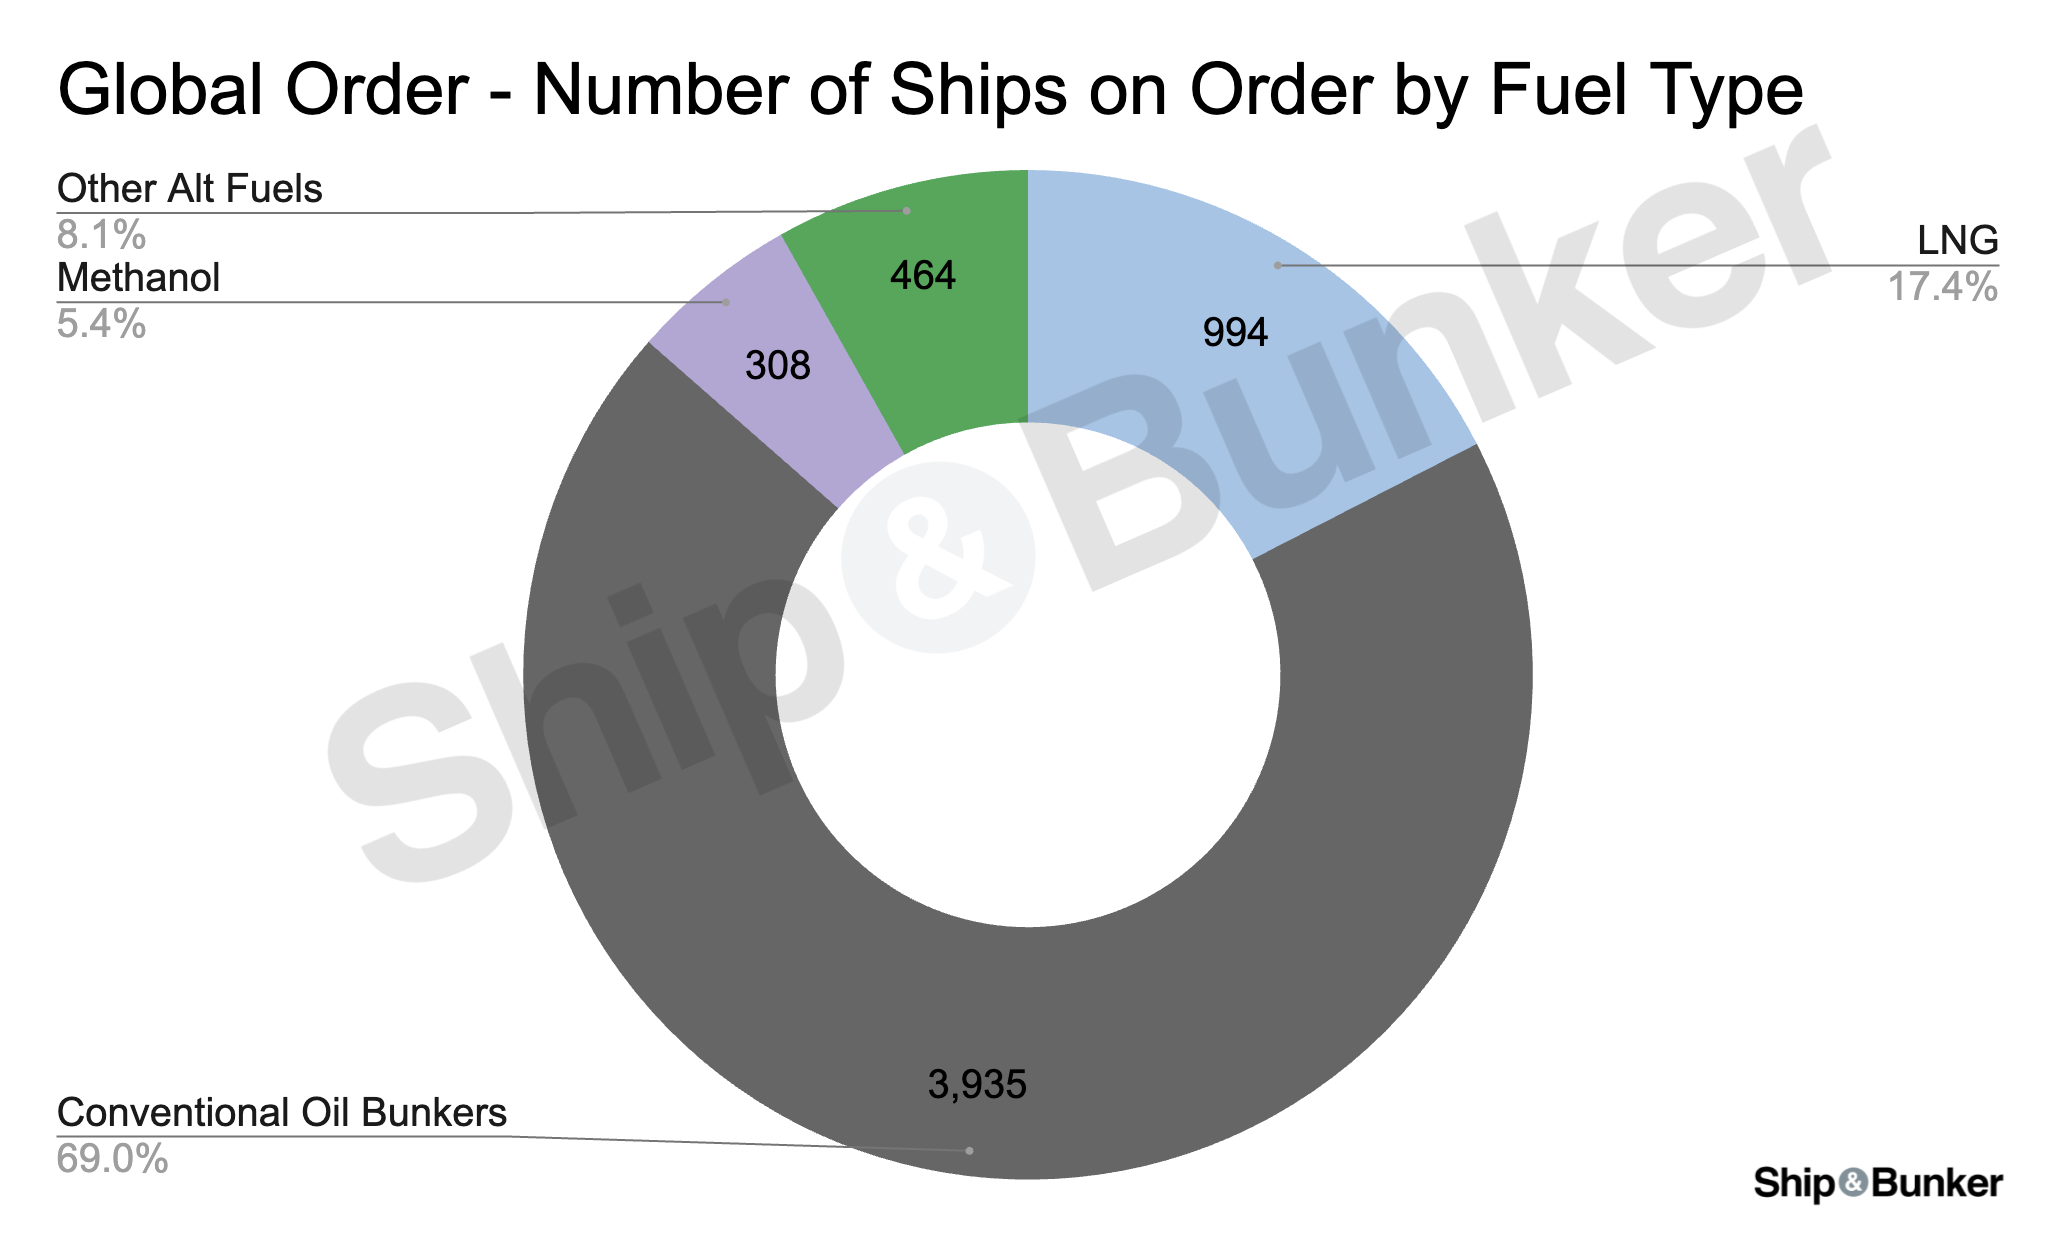
As a whole, vessels powered by conventional oil bunkers continue to dominate the orderbook, now commanding 69% of the individual ships and at 27.8 million MToE of demand, some 56% of the overall bunker demand.
LNG maintains its position as the most popular alternative fuel for the orderbook, with 14.3 million MToE of demand representing some 29% of the overall total. Methanol engines account for 4.6 million MToE of demand, 9% of the overall demand.
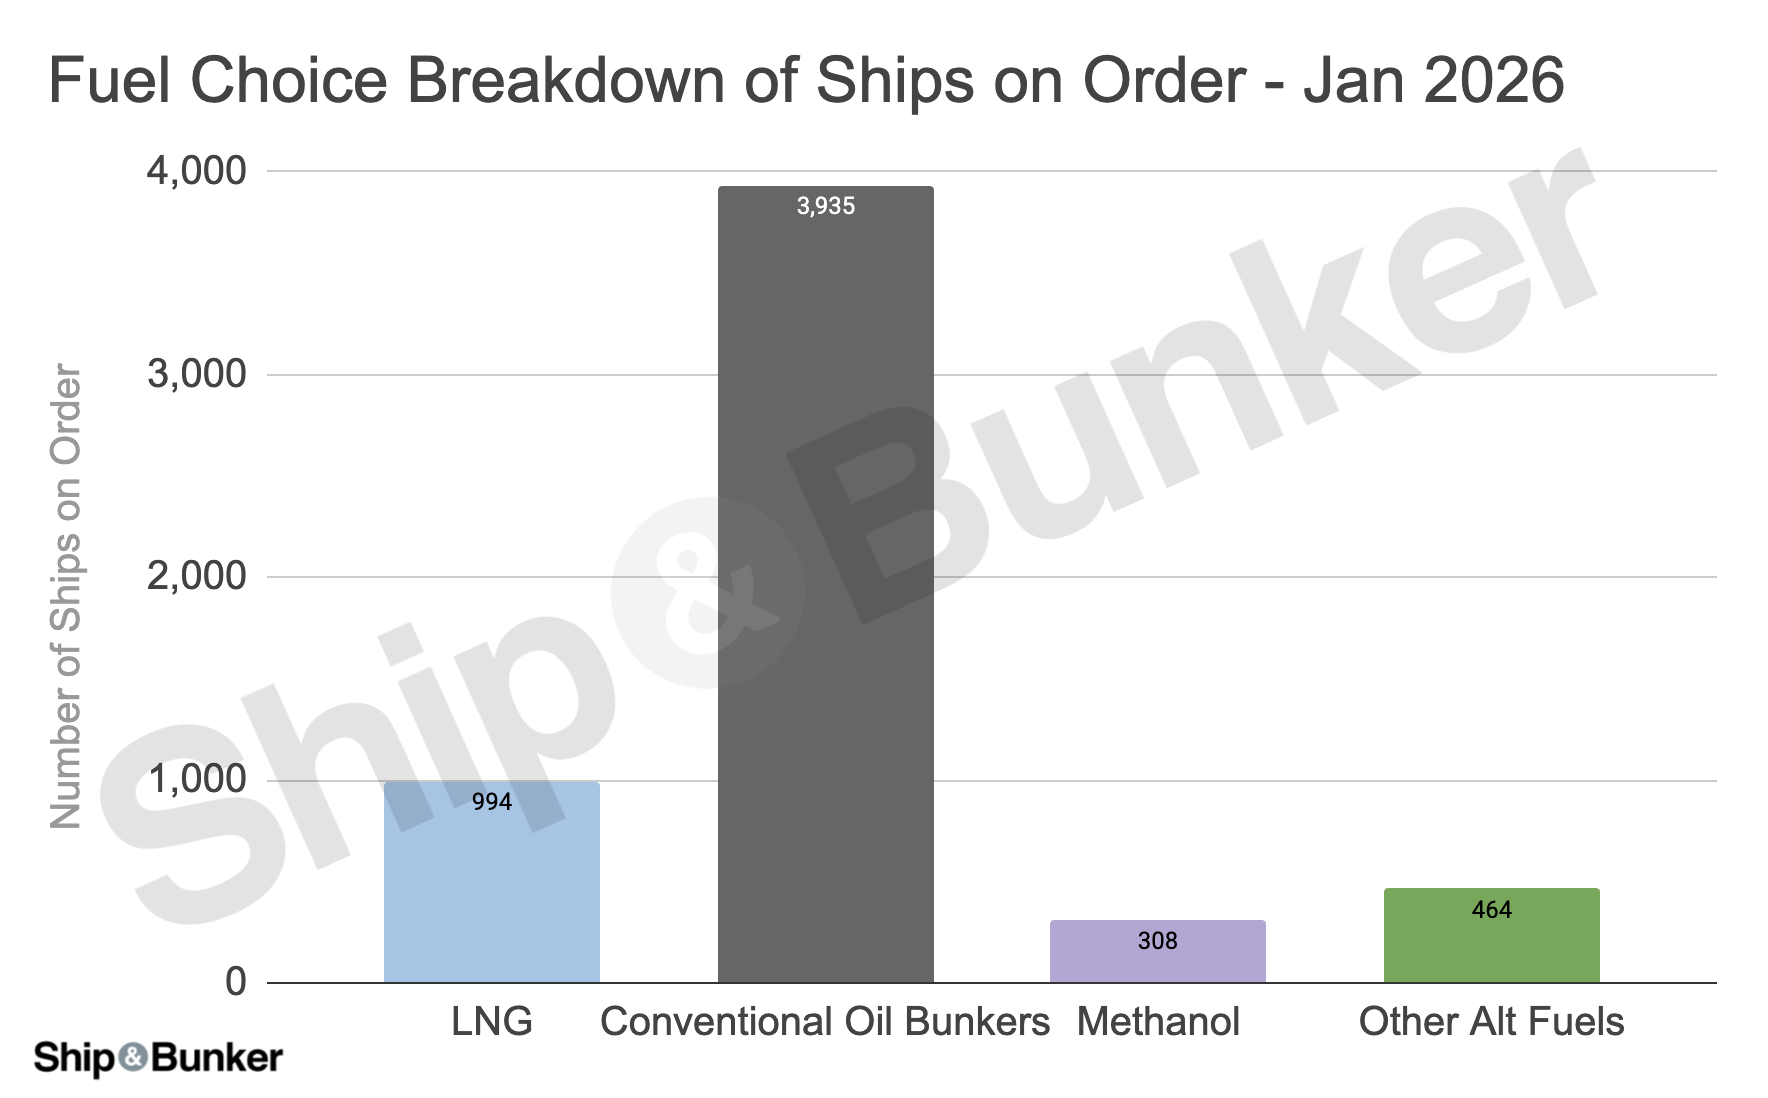
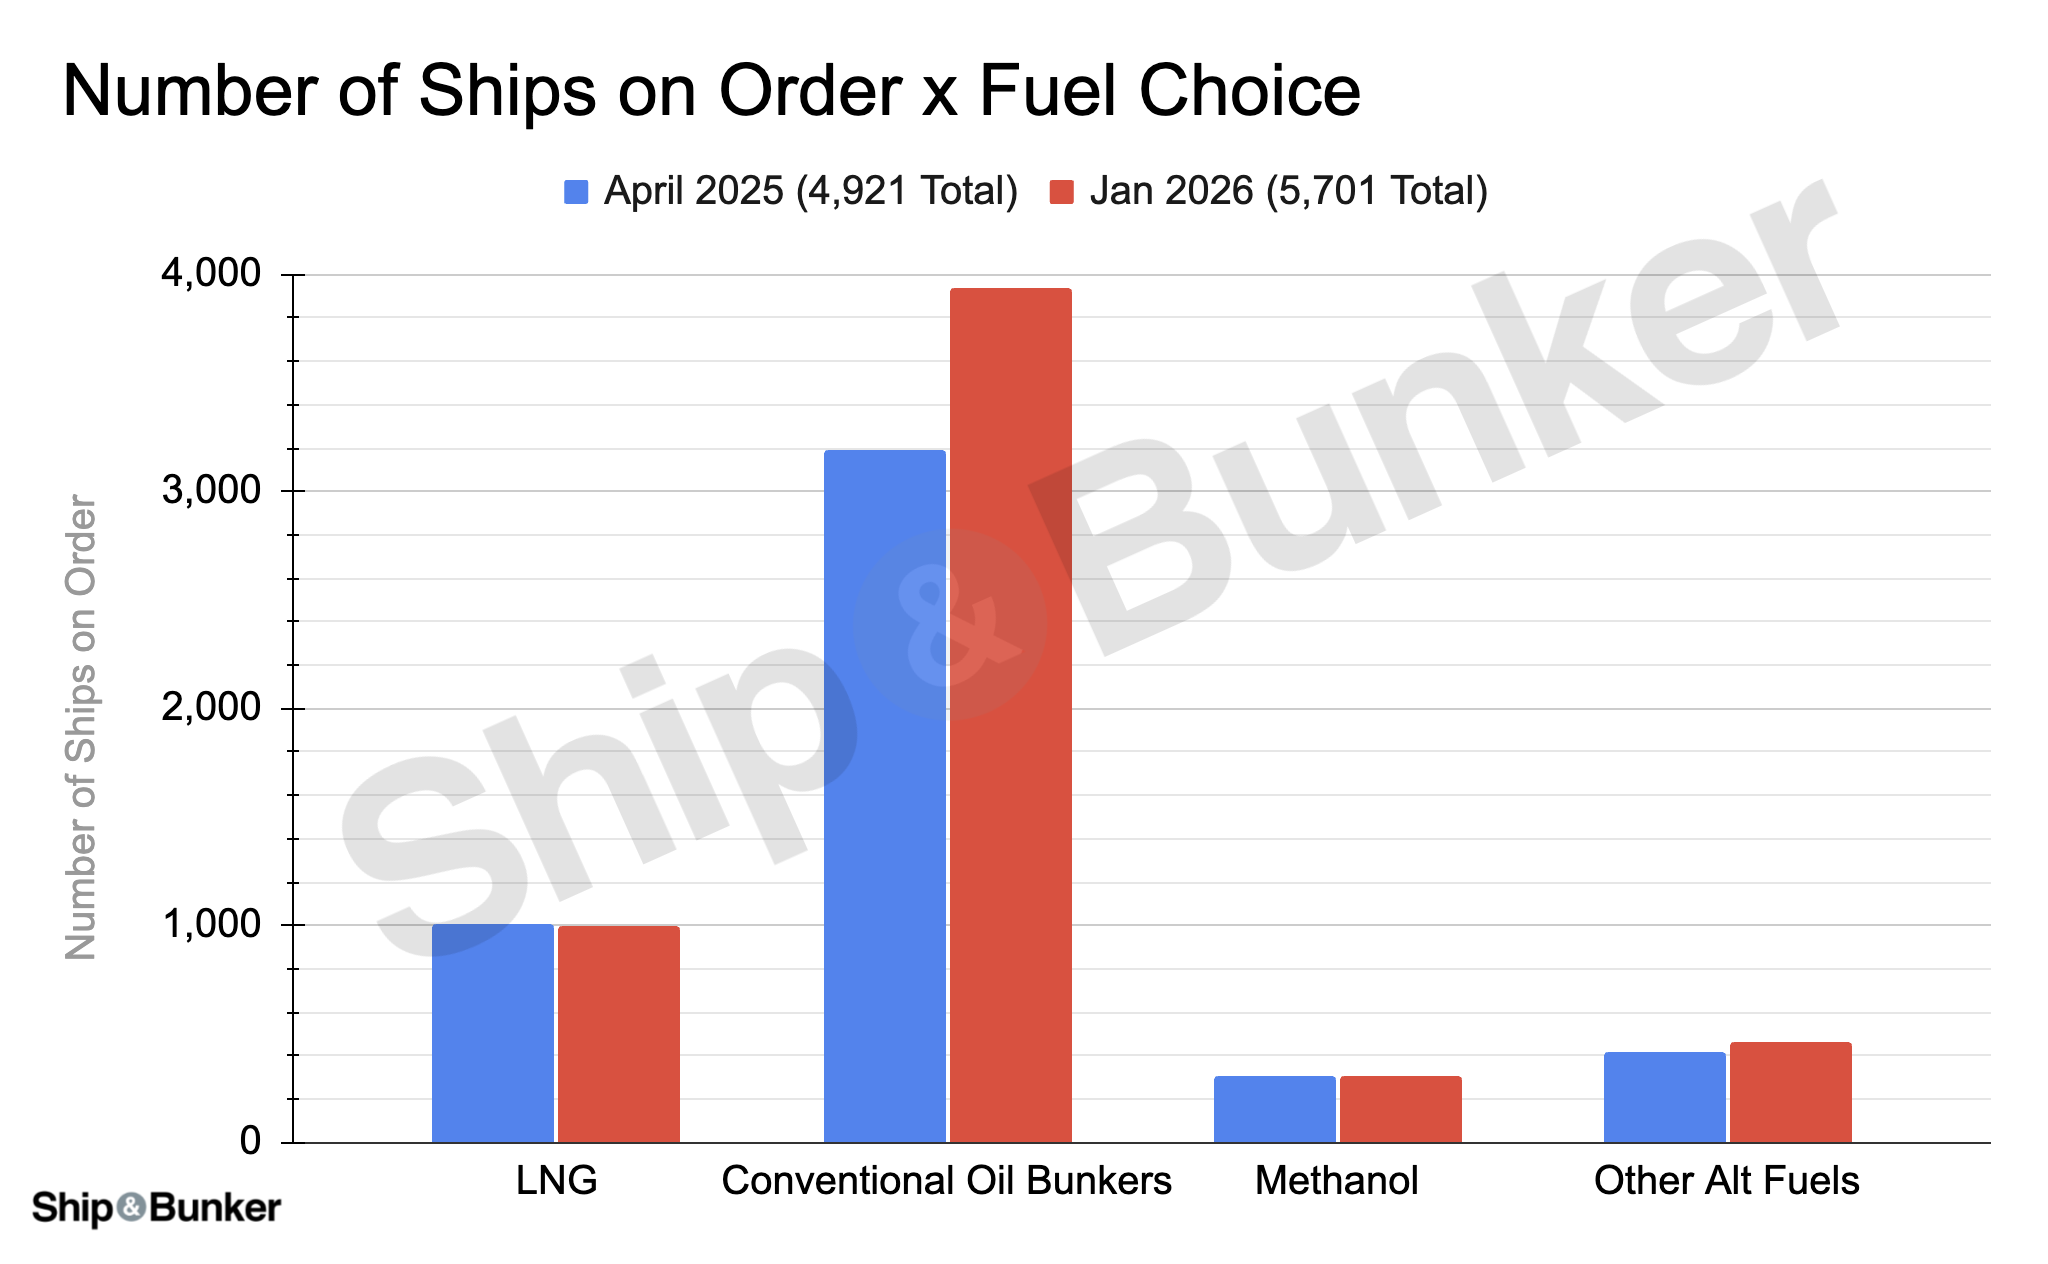
Given the above, it's no surprise that vessels powered by conventional oil bunkers continue to dominate the orderbook, now commanding 69% of the individual ships (up from 64% in April 2025) and some 56% of the overall bunker demand (up from 50% in April 2025).
LNG maintains its position as the most popular alternative fuel, with 17% of the total ships on order comprising 29% of the overall bunker demand.
Methanol engines account for a little over 5% of the total ships and 9% of overall demand.
Widespread Availability of Alternatives Still Not Expected Soon
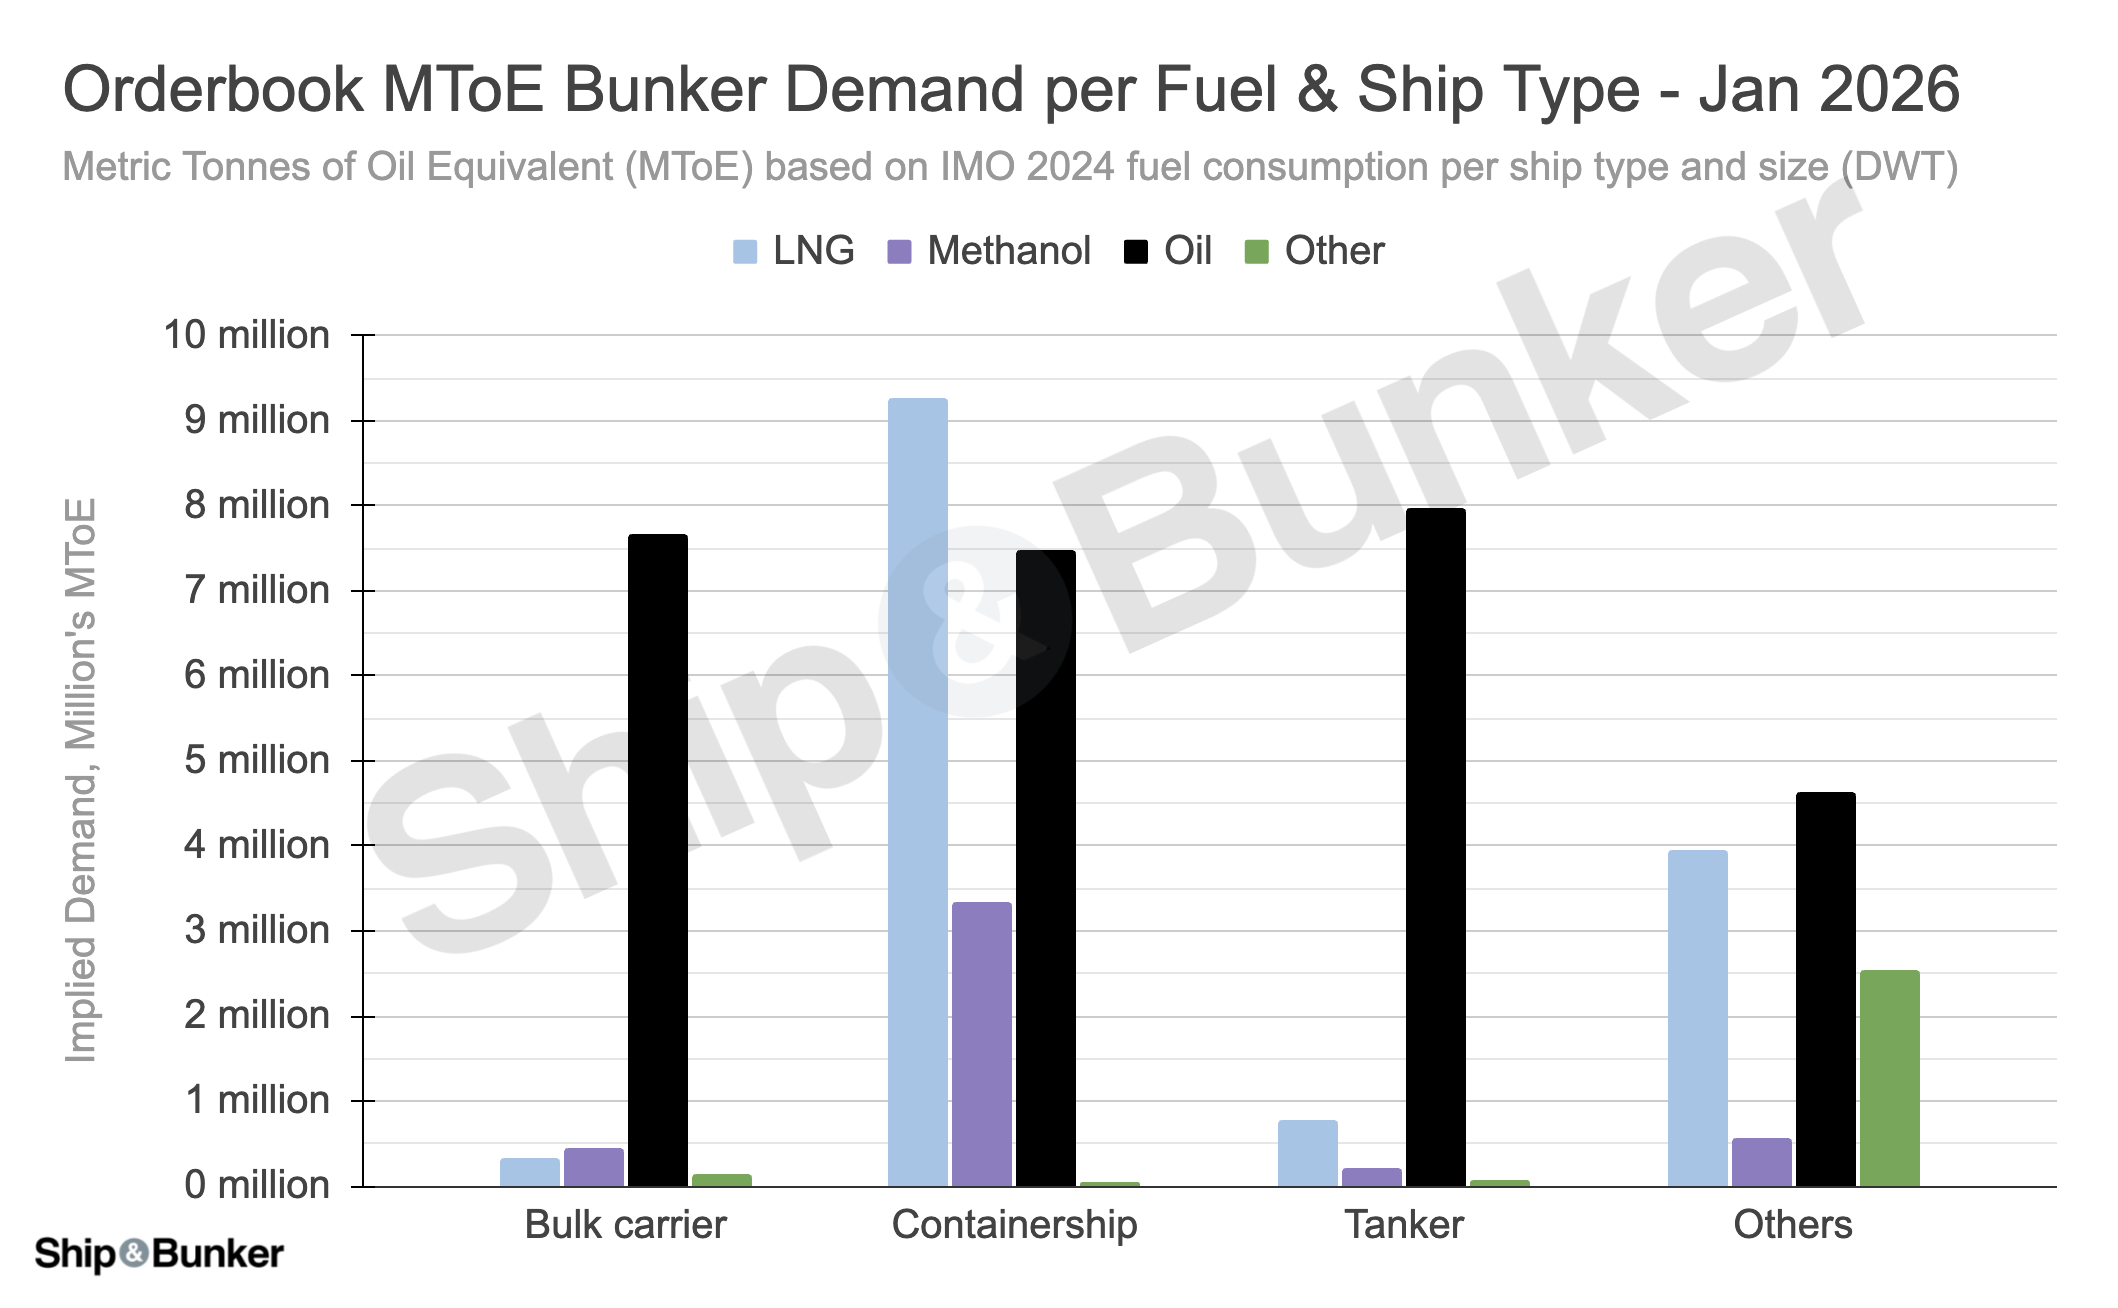
The type of ships that have opted for alternative fuels, and those sticking to conventional oil bunkers, tells us a lot about when we can expect to see widespread availability of alternative fuels. In short, only containerships operating on fixed routes have gone for LNG in a big way. The other large proportion of LNG demand from the orderbook is for 'other' ship types, this being attributable almost entirely to LNG carriers.
With the Orderbook's Bulk Carriers and Tankers almost entirely conventional fuel only, the message here seems as clear as before: tramp shippers still do not see there being widespread availability of alternative fuels any time soon, with availability of LNG and methanol bunkers likely being focused in a handful of primary bunkering hubs.
Not yet discussed in this analysis are the 'middle ground' of ships ordered with designs that enable them to be more easily converted to run on alternatives, such as those with an 'LNG-Ready' notation.
While potential demand from such ships is not guaranteed, should future retrofits for such tonnage take place then the Orderbook's alternative bunker demand could be higher.
How much higher? Clarksons Research indicate that 16% of the conventionally fuelled ships on order have an alternative fuel 'ready' notation — or 30% in terms of GT.
There are also alternative fuel capable ships that have 'ready' status for other fuel types, so the total share of the Orderbook that has an alternative fuel 'ready' status is 15% in number of ships and 21% in terms of GT.