
Overview
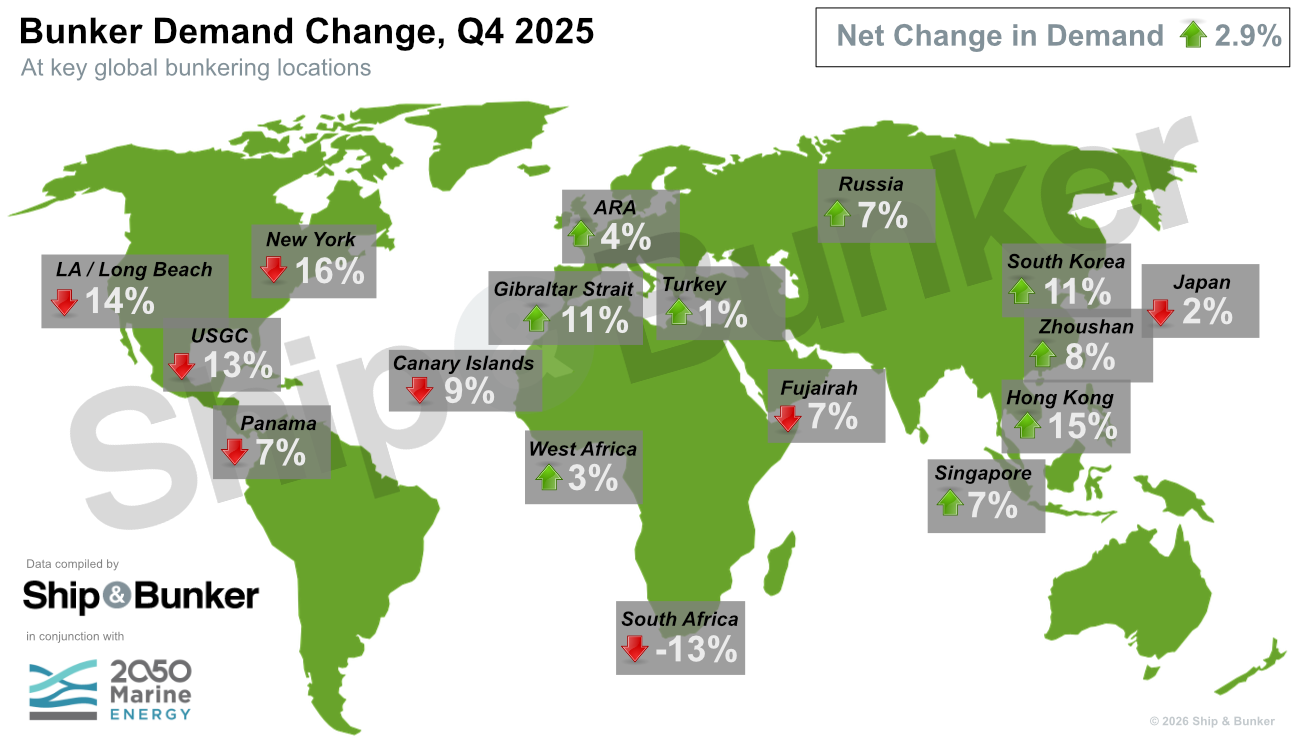
Demand at key marine fuel hubs jumped on a yearly basis in the fourth quarter of 2025, taking 2025's sales 2% higher than 2024 overall, according to the latest market survey of bunker sales volumes in 17 leading global locations.
As in previous quarters, Ship & Bunker and consultancy 2050 Marine Energy surveyed bunker market participants around the world alongside official data where available and found an average rise of 2.9% in volumes in the fourth quarter from the same period of 2024. The year-on-year advance compares with a 4.3% year-on-year gain in Q3. Q4 volumes sequentially were 1.3% higher than in Q3.
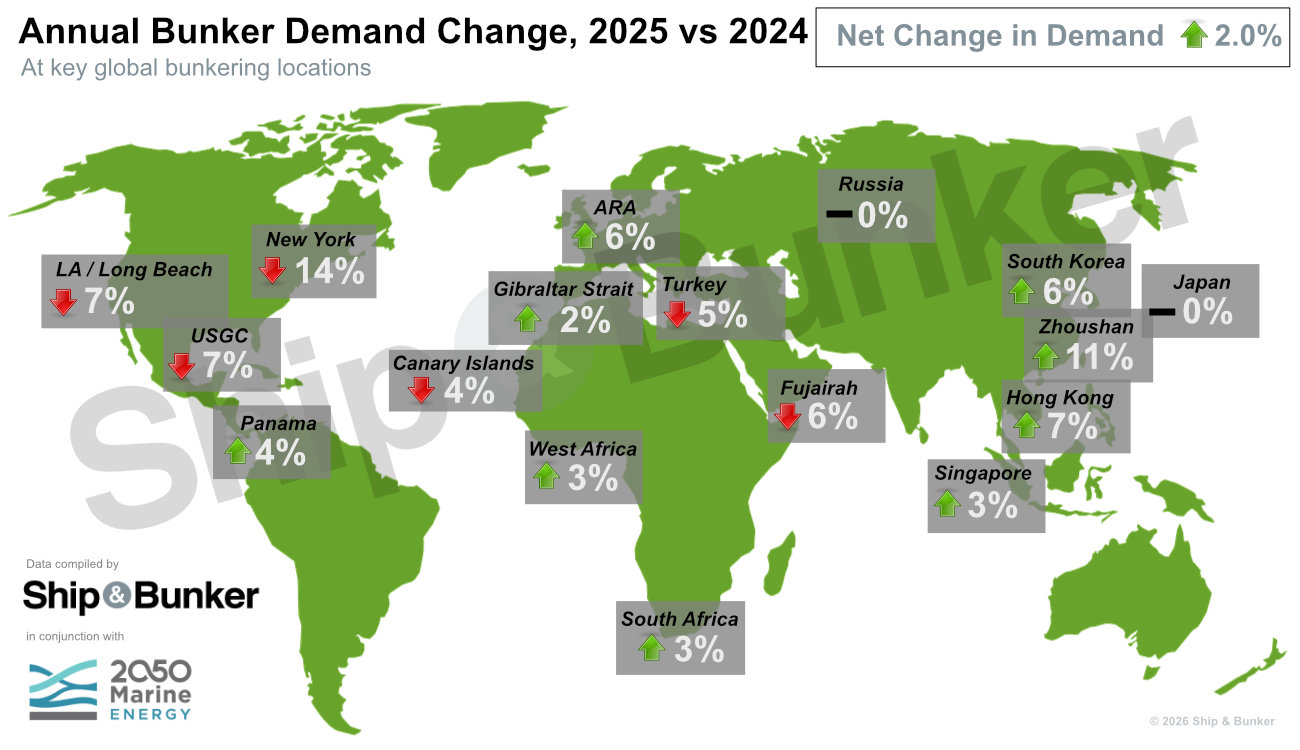
For 2025 as a whole, sales were up by 2% versus the same period a year earlier, and reached the highest global sales level since 2019.
The survey covers about 59.7% of the global demand total of 245.1 million mt for 2024 shown by official IMO data.
"Reviewing the global bunker demand during the last quarter of 2025 is a relatively simple and predictable task," Adrian Tolson, founder of 2050 Marine Energy, told Ship & Bunker.
"We can see trends that have been apparent for some time with Asian ports strengthening and some cases setting bunker volume records.
"We see European ports maintaining strong sales. We can see a small decline in ports that peaked with Red Sea disruptions now returning to a more normal state.
"And real decline can be seen in the Americas where the impact of tariffs has taken a toll on demand."
Weak Margins
The overarching theme at the end of 2025 was that of an oversupplied bunker market weighed down by intense competition from smaller trading firms limiting margins.
"We saw lower volumes in Q4 2025 and the start of 2026 due to an increasingly competitive market," Jesper Christensen, managing partner of BlackCoral Energy, told Ship & Bunker.
"This has however been offset to an extent in March and April due to the higher prices from the US-Iran war."
At that time oil-market analysts were predicting a large surplus of crude production from OPEC+ members would deliver some of the lowest prices seen since the early 2020s in early 2026.
"Q4 2025 was a quarter defined by complacency," Rakesh Sharma, managing partner of FLEX Commodities, told Ship & Bunker.
"The VLSFO market was oversupplied, East-West arbs were shut, and most participants were positioned for a bearish 2026 driven by a projected crude surplus. Singapore premiums were capped, Fujairah was seeing its weakest sales in months, and the HSFO complex was caught between volatile stock swings and steadily declining flat prices."
This was the backdrop for the start of the current Middle East conflict at the end of February, which overturned all views of the global energy markets.
"In hindsight, the market was sleepwalking into the most severe supply disruption in modern bunker history," Sharma said.
New Uncertainty
Uncertainty over excessive supply in the market has now been firmly replaced by concerns over potential demand shortages, and the outlook for 2026 is uncertain to a degree higher than at this point in any year in recent memory.
"This is the bunker market that existed before February 28th, 2026," 2050 Marine Energy's Tolson said.
"On that day everything changed, supply disruption rapidly spread across the bunker supply chain as its fragility became readily apparent.
"Simple predictability of bunker demand has gone; we will see ports gain and lose significantly as future data comes in, but this is not the same market structure and in the coming months we will see that."
Methodology
As with the previous surveys the areas covered by the survey are Singapore, the Amsterdam-Rotterdam-Antwerp (ARA) hub, Fujairah, the US Gulf, South Korea, Russia, the Gibraltar Strait, Hong Kong, Panama, Zhoushan, Japan, New York, West Africa, South Africa, the Canary Islands, Los Angeles/Long Beach and Turkey. Data is sourced from a combination of market participants and official records.
Individual Market Volumes & Commentary
Singapore
Q4 2025: 14.974 million mt
Q4 2024: 14.005 million mt
Q3 2025: 14.491 million mt
Year-on-year change: 7%
Quarter-on-quarter change: 3%
FY 2025: 56.342 million mt
FY 2024: 54.476 million mt
FY change: 3%
Singapore reached another record year of bunker sales in 2025, boosted by a strong annual and quarterly gain in the final three months of the year.
A total of 11,106 vessels arrived at the port to bunker during the period, up by almost 8% from the same period a year earlier. The average stem size slipped by 1% on the year to about 1,348 mt.
Ongoing strength in the tanker market is likely to be benefiting Singapore's sales, as well as a tendency for bunker demand to consolidate at the largest hubs at times of global economic uncertainty.
Singapore's Q4 sales broke down to about 51.9% VLSFO, 38.8% HSFO, 7.9% distillates and 1.4% biofuel blends, compared to about 52.4%, 37.7%, 7.3% and 2.6% respectively a year earlier. The share for 2025 as a whole was about 51.3% VLSFO, 38.7% HSFO, 7.6% distillates and 2.4% biofuels, compared to respective shares of about 54.3%, 37%, 7.1% and 1.6% a year earlier.
Singapore's LNG bunker sales, not included in the overall numbers in this survey, jumped by 34.7% on the year to 170,200 mt in the fourth quarter. 2025 sales gained 23.1% on the year to 571,400 mt.
ARA
Q4 2025: 4.39 million mt
Q4 2024: 4.222 million mt
Q3 2025: 4.569 million mt
Year-on-year change: 4%
Quarter-on-quarter change: -4%
FY 2025: 18.25 million mt
FY 2024: 17.272 million mt
FY change: 6%
The bunker market of the Amsterdam-Rotterdam-Antwerp hub saw an annual gain for a fifth consecutive year in 2025, with a year-on-year advance in Q4 adding to that total.
Strength in the container segment was a strong driver of Northwest European bunker demand growth in 2025. Volatile trade policy from the US is a test of this strength, but shows no sign yet of delivering overall declines in marine fuel sales.
Conflict in the Middle East in 2026 means a full return to the use of Suez is likely to be off the table for this year at least, meaning the boost to ARA bunker sales from ships taking longer routes around Africa is likely to remain in play for longer than previously thought.
The Port of Rotterdam's container throughput slipped by 0.2% on the year in 2025 as a whole, while dry bulk fell by 6.5% and liquid bulk sank by 1.5%. Total throughput was down by 1.7% on the year.
Breaking down Rotterdam's Q4 conventional and biofuel blend sales by fuel grade, VLSFO took up about 32%, HSFO 34.5%, distillates 17.3%, ULSFO 9.4% and biofuel blends 6.9%. That compares with respective shares a year earlier of 35.3%, 34%, 17.2%, 8.4% and 5.1%. The shares for 2025 as a whole were about 30.4% VLSFO, 36.6% HSFO, 17% distillates, 9.2% ULSFO and 6.7% biofuels, compared to respective shares of 32.8%, 35.5%, 15.8%, 8% and 8% a year earlier.
In early 2024 HSFO took up a greater share of Rotterdam's bunker demand than VLSFO for the first time since the IMO 2020 transition, and this trend has continued since then. This was driven in part by the Red Sea diversions, with the container segment being the most likely to have scrubbers installed, and this segment's demand being particularly boosted by the situation around the Red Sea and Suez.
Rotterdam's LNG and bio-LNG bunker sales in Q4 totaled 192,433 m3, down by 27% on the year. The total for 2025 was 998,623 m3, up by 5.8% on the year.
Gibraltar Strait
Q4 2025: 2.144 million mt
Q4 2024: 1.935 million mt
Q3 2025: 1.893 million mt
Year-on-year change: 11%
Quarter-on-quarter change: 13%
FY 2025: 8.064 million mt
FY 2024: 7.94 million mt
FY change: 2%
The Gibraltar Strait bunker market — taking in the ports of Gibraltar, Algeciras and Ceuta — saw strong annual and quarterly gains in Q4, taking its movement for 2025 as a whole to a modest gain after a drop in 2024.
Ceuta saw particularly strong growth in sales in Q4, with an annual gain of almost 82%.
The Red Sea crisis has had a negative impact on this market, with the sharp decline in transits through the Suez Canal meaning lower shipping activity into and out of the Mediterranean. This decline is most noticeable at Algeciras.
This effect should diminish when and if some ships return to using Suez, but this prospect appears a distant one in early 2026.
From the middle of 2025 onwards the introduction of the Mediterranean ECA has brought a profound shift to bunker sales across this region, driving increased MGO sales while VLSFO declines. The introduction of the ECA also slightly changes the economics of returning to using Suez, and may delay this return in some cases.
Fujairah
Q4 2025: 1.714 million mt
Q4 2024: 1.848 million mt
Q3 2025: 1.837 million mt
Year-on-year change: -7%
Quarter-on-quarter change: -7%
FY 2025: 7.131 million mt
FY 2024: 7.615 million mt
FY change: -6%
Fujairah was one of the weaker bunkering areas on the list in Q4, with an annual and quarterly decline in the last three months of the year adding to an overall decline for 2025 as a whole.
Sales for 2024 as a whole had gained 7% on increased supply and gains in the tanker market, but this gain was heavily pared by a 6% overall loss in 2025.
In the long term, the delay in any widespread return to ships using Suez is likely to provide a boost to Fujairah's sales, with ships avoiding Suez taking on greater quantities of fuel for their longer voyages. But in the short-term a far more important factor will be sales at Fujairah all but shutting down since early March as conflict spreads in the Middle East.
Fujairah's Q4 bunker sales broke down to about 61.7% VLSFO, 32.4% HSFO and 6% distillates, compared with about 66.2%, 29.1% and 4.7% respectively a year earlier. For 2025 as a whole the respective shares were about 64.2% VLSFO, 30% HSFO and 5.8% distillates, compared to respective shares of 67.1%, 28% and 4.9% a year earlier.
US Gulf
Q4 2025: 1.525 million mt
Q4 2024: 1.760 million mt
Q3 2025: 1.625 million mt
Year-on-year change: -13%
Quarter-on-quarter change: -6%
FY 2025: 6.44 million mt
FY 2024: 6.89 million mt
FY change: -7%
The US Gulf was one of the weaker performers on the list in Q4, with an annual and quarterly decline adding to a drop for the year as a whole.
Changes in US tariff policy under the Trump Administration, as well as responses to it worldwide, hit all of the country's bunkering regions in 2025. The volatile nature of the policy has led to stops and starts in shipping activity to and from the US, but the overall trend throughout the year was towards lower bunker demand.
This factor showed no signs of being alleviated at the start of 2026. But the current conflict in the Middle East, leading to much higher exports of energy from the US, is likely to bring about a turnaround in this market's fortunes.
Offshore activity remains firm, but competition between suppliers remains high with margins not as strong as seen in some other regions.
HSFO reportedly currently takes up about 35% of bunker demand in the region.
South Korea
Q4 2025: 2 million mt
Q4 2024: 1.8 million mt
Q3 2025: 1.95 million mt
Year-on-year change: 11%
Quarter-on-quarter change: 3%
FY 2025: 7.51 million mt
FY 2024: 7.11 million mt
FY change: 6%
The South Korean bunker market was one of the strongest performers on the list in Q4, with significant gains on both an annual and quarterly basis.
Total sales reached the highest level since 2019 for 2025 as a whole.
The market has seen a boost from increased demand for tankers, particularly in the wake of the Russia-Ukraine crisis. But over the longer term, increased competition remains a brake on South Korean volume gains.
Red Sea diversions are also helping drive sales in this market, and this effect shows no signs of diminishing soon as of early 2026.
But crude supply disruption from the Middle East since war broke out in Iran may soon make this market's prices uncompetitive with those elsewhere, particularly in the Transpacific trade.
Russia
Q4 2025: 1.07 million mt
Q4 2024: 1.05 million mt
Q3 2025: 1 million mt
Year-on-year change: 7%
Quarter-on-quarter change: 2%
FY 2025: 4.22 million mt
FY 2024: 4.2 million mt
FY change: 0%
The Russian bunker market saw a modest rise on an annual and quarterly basis in Q4, but little change overall when viewing 2025 as a whole.
Most top bunker firms immediately stopped deals at Russian ports after the full invasion of Ukraine in February 2022, and most international shipping firms stopped calling at Russian ports.
But Russia's mammoth commodity exports have largely continued flowing, with more use of the Russian-flagged fleet, supplied at Russian ports.
While Russian bunker sales at its ports have dropped significantly, it should be noted that its fuel oil cargo exports remain relatively strong.
Bunker sales in the Baltic and Black Sea have picked up, while sales in the Russian Far East have been more volatile.
The current conflict in the Middle East is likely to deliver a considerable boost to Russian commodity exports as other producer countries find themselves cut off from global markets. That said, at the same time Ukraine has stepped up its attacks on Russian energy infrastructure, including the Baltic ports of Primorsk and Ust-Luga, which may put downward pressure on exports.
Firm data on Russian demand has been thin on the ground since early 2022, with the country's major oil companies halting data publication.
Zhoushan
Q4 2025: 2 million mt
Q4 2024: 1.86 million mt
Q3 2025: 2.135 million mt
Year-on-year change: 8%
Quarter-on-quarter change: -6%
FY 2025: 8 million mt
FY 2024: 7.205 million mt
FY change: 11%
The Zhoushan bunker market followed the trend of strength at Asian locations in Q4, with a solid annual gain in the last three months of the year boosting total 2025 sales growth to 11%.
2025's sales reached a new record annual high, and last year's total was nearly double the level of sales seen in 2019.
The main long-term factor behind the port's ongoing growth has been Beijing's goal of taking a greater share of the global market for marine fuel production and sales, with tax relief for bunker output.
In the nearer term, the Trump Administration's trade policies, in particular its tariffs on imports from China, threaten Zhoushan's growth.
The tariff rate was changed multiple times throughout 2025, and this volatility may produce stops and starts in bunker demand, but the overall trend over the coming year is likely to be downwards.
At the same time, the supply of Middle Eastern crude to Chinese refineries being cut off in 2026 is likely to threaten Zhoushan's position relative to other ports in the world, particularly the US West Coast.
Panama
Q4 2025: 1.387 million mt
Q4 2024: 1.182 million mt
Q3 2025: 1.493 million mt
Year-on-year change: -7%
Quarter-on-quarter change: 17%
FY 2025: 5.306 million mt
FY 2024: 5.097 million mt
FY change: 4%
Panama's bunker sales recovered on a quarterly basis in Q4, but remained below the level seen a year earlier, paring last year's overall 4% gain.
US trade policy and its impact on global shipping markets was the main factor limiting sales in the second half of 2025, and the local market will also keep a close eye on tensions between the US and Panamanian governments.
Q3's sales had been the lowest quarterly total for Panama since the second quarter of 2024. But looking at 2025 as a whole, sales reached the highest level since 2019.
Panama's Q4 sales broke down to about 66.7% VLSFO, 22.2% HSFO and 10.8% distillates, compared with 60%, 29.8% and 10.2% respectively a year earlier. The average stem size slipped by 7.1% on the year to about 774 mt in Q4.
For 2025 as a whole the breakdown was 64.9% VLSFO, 24.7% HSFO and 11.1% distillates, compared to respective shares of 60.7%, 29.1% and 10.3% a year earlier. The average 2025 stem size lost 6.9% on the year to about 710 mt.
New York
Q4 2025: 995,000 mt
Q4 2024: 1.19 million mt
Q3 2025: 1.075 million mt
Year-on-year change: -16%
Quarter-on-quarter change: -7%
FY 2025: 4.19 million mt
FY 2024: 4.865 million mt
FY change: -14%
New York's bunker volumes saw sharp declines on an annual and quarterly basis in Q4, taking its decline for 2025 as a whole to 14%.
The drop in 2025's total left this market with its lowest annual total since 2020.
Volatile tariff policy from the Trump Administration has been the biggest negative factor for the New York market, in particular tariffs set by the US and EU on each other's products. Further declines for this reason appear unlikely in 2026, with the tariff policy somewhat weakened by the US Supreme Court ruling on Congressional approval, but significant improvements on this front also appear unlikely.
However, the breakout of conflict in the Middle East in 2026 and the knock-on effect on global energy markets is likely to make all US bunkering locations more competitive globally this year.
Hong Kong
Q4 2025: 1.4 million mt
Q4 2024: 1.215 million mt
Q3 2025: 1.36 million mt
Year-on-year change: 15%
Quarter-on-quarter change: 3%
FY 2025: 5.494 million mt
FY 2024: 5.139 million mt
FY change: 7%
Hong Kong's bunker market was like other Asian bunkering locations in seeing annual and quarterly gains in Q4, boosting its annual sales total.
Hong Kong's total for 2025 was the highest level since 2021, despite weaker sales earlier in the year.
Red Sea diversions boosting the container segment have continued to support Hong Kong's sales throughout 2025, and this effect shows no sign of disappearing, but this has been significantly tempered by a slowing Chinese economy.
The Trump Administration's tariff policy has to some extent limited sales in Hong Kong, but the strong growth throughout Asia last year shows this effect has largely been constrained to the US. Competition from elsewhere in China remains a bigger threat.
Japan
Q4 2025: 879,000 mt
Q4 2024: 901,000 mt
Q3 2025: 811,000 mt
Year-on-year change: -2%
Quarter-on-quarter change: 8%
FY 2025: 3.254 million mt
FY 2024: 3.258 million mt
FY change: 0%
Japan's bunker market saw a strong quarterly gain in Q4, but a modest decline from the end of 2024 and little change in its annual total.
The country's total for 2024 as a whole had been down by 14% on the year and the lowest since at least 2018, and 2025's total was marginally lower than the previous year's.
Strength in the tanker market was one of the prime drivers of higher sales in Japan in Q3. This is likely to persist into the start of 2026.
Changes in US trade policy appeared to be having a negative impact on Japanese sales earlier in 2025, but this effect diminished in the second half of the year. In 2026 a far more important factor will be the war in the Middle East, with Japanese producers now scrambling to secure alternative crude and feedstock supply at the same time as their competitors in the region.
Los Angeles/Long Beach
Q4 2025: 590,000 mt
Q4 2024: 690,000 mt
Q3 2025: 620,000 mt
Year-on-year change: -14%
Quarter-on-quarter change: -5%
FY 2025: 2.49 million mt
FY 2024: 2.68 million mt
FY change: -7%
The bunker markets of Los Angeles and Long Beach saw declines on both an annual and quarterly basis in Q4, boosting this location's 2025 decline to 7%.
The fall for 2025 as a whole left this market's annual sales at the lowest level since 2023 last year, and only marginally above that year's total.
The Trump Administration's tariff policy and responses to it from elsewhere in the world are the main factor behind this drop. Los Angeles is one of the hardest-hit ports because of its reliance on the Asia-US container market.
Increased container tonne-mile demand driven by Red Sea diversions remains a boon to this market, and one that looks set to last throughout 2026.
The effect of the Middle East conflict on global energy supply is likely to boost this market, as with all other US locations, for at least the first half of 2026.
Canary Islands
Q4 2025: 794,000 mt
Q4 2024: 872,000 mt
Q3 2025: 752,000 mt
Year-on-year change: -9%
Quarter-on-quarter change: 6%
FY 2025: 3.254 million mt
FY 2024: 3.384 million mt
FY change: -4%
The Canary Islands were one of the weaker performers on the list in Q4, with a significant annual decline taking the total for 2025 as a whole slightly lower on the year.
The Canaries are a natural stopping-point for ships taking longer routes around Africa to avoid the Red Sea, and this delivered record sales in 2024, with sales in 2025 somewhat diminished from this high point.
No increase in Red Sea and Suez transits now appears likely in the short term, meaning sharp declines are unlikely in 2026 on this front. But the war in the Middle East and its knock-on effect on global energy markets may make this location's prices less competitive.
West Africa
Q4 2025: 824,000 mt
Q4 2024: 800,000 mt
Q3 2025: 815,000 mt
Year-on-year change: 3%
Quarter-on-quarter change: 1%
FY 2025: 3.189 million mt
FY 2024: 3.095 million mt
FY change: 3%
The West African bunker market saw a small gain at the end of the year, taking 2025's overall sales growth to 3%.
This left 2025's total for this market at the highest level since 2019.
Strength in the tanker market is now delivering a boost to demand in the region, and this phenomenon is likely to be significantly strengthened by the current conflict in the Middle East.
West Africa's strength in 2024 and 2025 was mostly down to the Red Sea diversions from ships avoiding Suez, and this effect is likely to continue.
West Africa was not the first choice of bunkering location for ships taking longer routes around the Cape of Good Hope to avoid the Red Sea, but this region nonetheless saw some gains because of the situation in the Middle East, and will see further volatility as the situation evolves.
More supply is steadily joining this market, with refinery capacity being added in Nigeria and Ghana, which may make prices more competitive with ports elsewhere in the world. The supply outage at Algoa Bay in South Africa has also brought benefits to West Africa since late 2023.
Turkey
Q4 2025: 567,000 mt
Q4 2024: 563,000 mt
Q3 2025: 559,000 mt
Year-on-year change: 1%
Quarter-on-quarter change: 1%
FY 2025: 2.23 million mt
FY 2024: 2.339 million mt
FY change: -5%
Turkey's bunker market saw modest gains on both an annual and quarterly basis in Q4, but saw sales for 2025 as a whole still decline slightly.
2025's total was the lowest since 2023.
The country's bunker market has been one of the bigger victims in this industry of the war in Ukraine. Its position at the entrance and exit of the Black Sea meant it had most to lose from shipping activity there grinding to a halt.
While Russian oil exports are still flowing out of the Black Sea, the tankers carrying these shipments are bunkering at Russian ports.
Any rapid end to the Ukraine war would be likely to deliver a significant boost to Turkish volumes. But for now this prospect remains distant, and the recent spectacle of Russian shadow fleet tankers coming under attack near Turkish waters will do little to encourage marine fuel sales in the area.
Red Sea diversions have also been a negative for the Turkish market, with transits through Suez severely limited over the past two years. A widespread return to the use of Suez would deliver a boost in demand for shipping heading to and from Asia.
In 2025 the introduction of the Mediterranean ECA is having a profound impact on the Turkish market throughout the year, driving an increase in MGO sales and the emergence of a ULSFO market.
Since the introduction of the Med ECA, Turkey's sales now break down to about 55% gasoil, 25% ULSFO, 10% VLSFO and 10% HSFO.
South Africa
Q4 2025: 225,000 mt
Q4 2024: 260,000 mt
Q3 2025: 280,000 mt
Year-on-year change: -13%
Quarter-on-quarter change: -20%
FY 2025: 1.045 million mt
FY 2024: 1.01 million mt
FY change: 3%
The South African market declined at the end of 2025, and the size of this market remains considerably below historical levels.
2025's total was up by 3% from the previous year, but still down to almost only a third of the size seen in 2019.
The long-term issues remain that demand has shifted considerably to Singapore, and supply remains constrained by a shrinking local refining industry.
But supply at Algoa Bay — all but shut down since September 2023 after a tax and customs dispute between the bunker industry and the government — is starting to return after the South African Revenue Service imposed new protocols on the storage of imported bonded fuels in customs and excise warehouses in November.
In 2025 supply restarted on a small scale, but it remains unclear to what extent the largest suppliers will return to this market. In September 2025 Peninsula announced it would launch a joint venture with a local logistics partner focused on Algoa Bay, and this may in time deliver a larger boost to volumes.
Demand at other South African ports has been boosted by Red Sea diversions, but the market has failed to take advantage of the situation to the same extent as other African locations.
South Africa's bunker sales break down to about 60% VLSFO, 10% HSFO and 30% distillates.